
Introduction — What you'll get and who this is for
If you run multi-tenant SaaS on public cloud and want predictable margins, faster troubleshooting, and clean usage-based pricing, this is for you. I’m Mike Patterson — impatient with surprises and allergic to vague cost reports. This August 2026 update keeps the core playbook but adds the real-world pressure points that hit teams this year: metered LLM/model billing, vector-store egress, more granular cloud billing lines, and tighter regulatory scrutiny around telemetry.
You’ll come away with a prioritized, actionable plan to attribute costs to tenants reliably, instrument inference paths and vector DBs, and ship customer-facing usage reports that reduce disputes.
Prerequisites / Context
Before you start, have the basics in place:
- An immutable tenant identifier (tenant_id, org_id) available at ingress.
- Access to your cloud Cost & Usage Report (CUR) or equivalent, delivered to object storage for processing.
- An observability pipeline (OpenTelemetry SDKs + Collector) and at least one backend for metrics/traces/logs.
- A data warehouse or query layer (Athena, BigQuery, Snowflake, Redshift) for joining telemetry to billing lines.
Why this matters now: through 2026 the visibility problem shifted — cloud and model providers now expose finer billing dimensions (e.g., per-model compute, request vs. hosting, egress), and customers increasingly expect usage transparency. At the same time, vector DB and search egress are a recurring surprise on invoices. If you don’t instrument these flows, you’ll get surprised — and so will your customers.
Overview: Updated 8-step approach (Aug 2026)
- Design a canonical tenant identity and propagation contract
- Instrument requests, background work, vector DBs, and model inference with tenant context
- Centralize and enrich telemetry with an OpenTelemetry Collector pipeline and token-count sidecars
- Tag cloud resources, enable detailed cost reports, and capture provider model/egress lines
- Map telemetry to costs: direct, usage-based (inc. inference/tokens/egress), and amortized
- Build tenant dashboards, SLAs, alerts, and a transparent billing API
- Control cardinality, sampling, privacy, and retention — cost-aware sampling for models
- Close the loop with reconciliations, pricing changes, and escalation workflows
1. Design your tenant identity model
Same drill: pick one canonical key and enforce it. In 2026, the difference-maker is making that key authoritative at the edge and in vector DB requests.
- Use a stable format (UUID or numeric). Never use emails or tenant names as the canonical key.
- Enforce the key at ingress (API Gateway, CDN edge) — reject or flag requests without it. Missing tenant context is the biggest attribution leak.
- Define a propagation contract: header (X-Tenant-ID), message attributes for queues, metadata fields for background jobs, and explicit fields for vector DB queries and model calls.
Why: vector DBs and model endpoints are often called directly from front-ends or edge code. If tenant context drops before the embedding or query call, you lose the only reliable link between usage and billing.
2. Instrument requests, background work, vector DBs, and inference with tenant context
OpenTelemetry remains the standard for correlating traces, metrics, and logs — extend it to include model-level attributes and vector-store metadata.
- Set tenant.id as a span attribute and tenant_id as metric/log field. Keep naming consistent: "tenant.id" for spans, "tenant_id" for metrics/logs.
- For background jobs, include tenant_id in message attributes (SQS/Kafka) and ensure workers copy it to spans, metrics, and logs.
- Instrument every model inference: model.name, model.size (or class), tokens_in, tokens_out, and latency. If you use managed model services, capture model_id and request_id from provider responses.
- Instrument vector DB calls: query_bytes, returned_items, and downstream egress. Tag those with tenant_id so egress and retrieval costs can be attributed.
- Emit a lightweight "cost event" for expensive operations (e.g., inference request > X tokens) so you can aggregate high-cost actions separately.
Concrete convention: X-Tenant-ID header, OTEL attribute tenant.id, and log field tenant_id. For inference: add attributes tokens.in and tokens.out or tokens.total.
3. Centralize telemetry with an OpenTelemetry Collector pipeline
Run a Collector (self-hosted or managed) as the single place to normalize, enrich, redact, and apply cost-aware sampling.
- Receive OTLP/gRPC from SDKs and token-count sidecars attached to model clients.
- Process: normalize tenant keys, enrich spans with cloud metadata (account, region, cluster), add pricing metadata (model SKU, vector DB plan), and redact PII.
- Apply cost-aware sampling: sample more traces for high-token requests and top-spend tenants, less for routine traffic.
- Export to metrics/tracing backends and to your warehouse for cost joins (OTLP → CSV/parquet to S3 or directly to warehouse).
Operational rule: make missing tenant context a ticket-generating event — don’t just drop it. Store rejected requests short-term for audits.
4. Tag cloud resources and enable detailed cost reports
Tagging still matters, but augmented billing dimensions are now essential.
- Enforce cost tags (tenant:id, app, env) via IaC modules (Terraform/Pulumi) and pre-deploy hooks.
- Enable the provider’s detailed billing export and include resource IDs, tags, and model/inference billing lines where available.
- Capture usageType, product, and any model-specific fields the provider emits. Many providers now emit separate lines for model-hosting vs. per-request inference and for egress.
- Use Billing Conductor or an equivalent to apply internal price sheets and to present chargebacks without per-tenant accounts (reserve account-per-tenant for isolation or compliance cases only).
Note: some managed services aggregate billing into rolled-up lines. That’s where telemetry joins are indispensable to split out tenant responsibility.
5. Map telemetry to costs: direct, usage-based, and amortized
Costs in 2026 typically fall into three buckets: direct-tagged, observable usage-based, and amortized platform costs. New critical drivers: model inference (tokens/requests), vector DB egress, and third-party API bills.
- Direct: dedicated resources you can tag per-tenant (reserved instances, dedicated volumes).
- Usage-based: tie shared compute, model hosting, and egress to measured usage — CPU-seconds, tokens, query-bytes, or returned items.
- Amortized fixed share: control plane and shared platform overhead split by seats, monthly active users, or a flat platform fee.
Example allocation formula (monthly):
TenantCost = DirectTagged + (TenantCPU / TotalCPU)*SharedCompute + (TenantTokens / TotalTokens)*InferenceCost + (TenantEgressBytes / TotalEgressBytes)*EgressCost + AmortizedShare
Implementation tip: join CUR rows to telemetry aggregates at matching time buckets (UTC) in your warehouse and include a "confidence" column. Attribution is an estimate — track variance against actual billed lines and iterate weights monthly.
6. Build tenant dashboards, SLAs, alerts, and billing APIs
Two audiences: internal platform/product teams and customers. Both need transparency and a clear method for disputes.
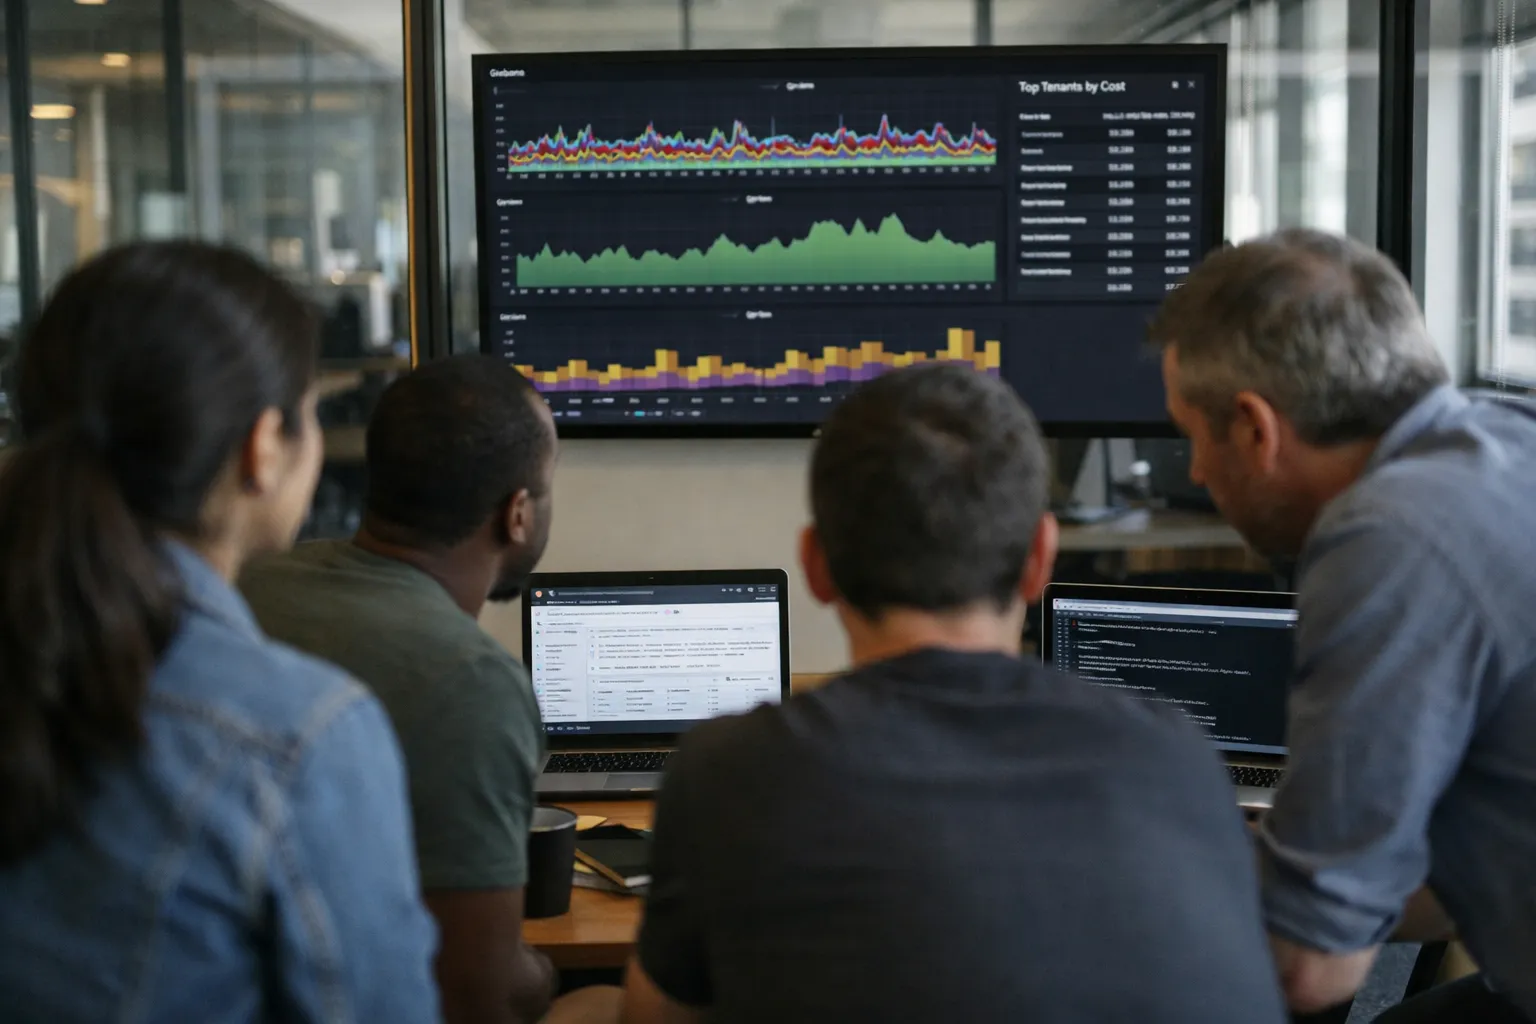
- Platform dashboards: top N tenants by estimated monthly cost, noisy neighbor charts (CPU%, memory%), and per-tenant inference profiles (tokens per day, 99th centile latencies).
- Customer portals/APIs: per-tenant usage breakdown (requests, storage, tokens, vector DB egress), estimated charges, and downloadable reconciliations. Include a "method" field explaining how shared costs were split.
- Alerts: engineering alerts on noisy tenants, finance alerts on billing thresholds, and customer-facing notifications when usage crosses quota or billable thresholds.
Transparency reduces disputes. Expose estimated cost, allocation method, and confidence level in every tenant report.
7. Control cardinality, sampling, privacy, and retention
Telemetry costs are now as likely to surprise you as cloud bills. Adopt principled limits.
- Metrics: limit per-tenant metric families to essential signals (errors, latency, usage counters). Aggregate lower-value signals to tiers (free/paid/enterprise).
- Traces: cost-aware sampling — sample more for top-spend tenants, long token requests, or when anomalies trigger.
- Logs: redact PII in the Collector. Keep raw logs short-term in object storage and export only aggregates for long-term analysis.
- Retention: raw telemetry 30–90 days, aggregated cost/usage trends 12–36 months for pricing analysis and audits.
New 2026 practice: token-budget sampling — when a request consumes >X tokens, force a full trace sample to capture expensive outliers and allow post-mortem cost attribution without sampling every token-level event.
8. Surface costs to customers and close the loop
Once you can estimate costs reliably, operationalize the outcomes:
- Expose a cost breakdown API and billing UI. Include "confidence" and a clear "method" for shared-cost allocations.
- Inform product decisions: instrument features with tenant_id so product owners can see ROI vs. cost — it's the fastest way to curb costly features.
- Translate allocation outputs into pricing (e.g., storage per GB, inference per 1K tokens, vector DB retrieval add-on) and publish quotas and alerts.
- Automate reconciliations: reconcile your estimated totals to provider CUR monthly and adjust allocation weights accordingly.
Escalation: when a tenant’s estimated cost spikes >50% month-over-month, trigger a workflow for engineering, finance, and account management — and include a single explanation piece for the customer.
Common mistakes and how to avoid them
- Missing tenant context: missing IDs at the edge or in vector DB calls. Fix: guardrails at API gateways and CI checks for instrumentation.
- Using the wrong allocation metric: attributing compute by request count when heavy work is inference/token-bound. Fix: pick metrics that correlate to the underlying resource.
- Time alignment errors: joining telemetry and CUR with mismatched windows. Fix: normalize to UTC and bucket consistently.
- Over-instrumenting high-cardinality attributes: blowing observability bills. Fix: tier metrics and sample traces adaptively.
- Ignoring vector DB egress: embedding searches and returned results cause network and provider costs. Fix: instrument query_bytes and returned_items and include them in allocation.
Pro Tips (practical, battle-tested)
- Start with one dimension (CPU or tokens) and validate against known dedicated costs before expanding allocations.
- Instrument feature flags with tenant_id — you’ll find some features are invisible cost sinks.
- For expensive inference, add per-tenant soft quotas and notifications before hard throttles; offer cached or batched alternatives as add-ons.
- Keep a confidence score on estimated invoices; publish it internally and include it in customer reports to reduce back-and-forth.
- Automate monthly reconciliation and store adjustment history — that history is gold when you negotiate contracts with large customers.
Updated case example — productivity SaaS (anonymized, 2026)
A mid-market productivity SaaS instrumented tenant-aware telemetry in Q1–Q2 2026 and implemented token-count sidecars for their model calls plus query_bytes tracking for vector DB searches. They:
- Enforced X-Tenant-ID at the edge and added tenant.id to spans, metrics, and log fields.
- Captured tokens per inference request and bytes per vector query, then joined those aggregates to provider billing lines.
- Allocated inference costs by token share and moved the highest-consumption customers to custom plans with per-1K-token pricing.
Result: clearer conversations with customers, fewer billing disputes, and the ability to offer a caching add-on that avoided repeated costly searches.
Checklist to deliver value in 90 days (practical)
- Enforce canonical tenant_id at ingress and log rejections.
- Deploy OTEL SDKs and a Collector that normalizes tenant keys and redacts PII.
- Instrument model clients for token counts and add simple query_bytes for vector DB calls.
- Enable detailed CUR and deliver to S3/object storage.
- Run a warehouse job joining CUR to telemetry aggregates (CPU, tokens, storage, egress).
- Build a platform dashboard: top tenants by estimated cost, noisy neighbors, and top inference consumers.
- Implement cost-aware sampling and retention policies for traces/logs.
- Expose a customer-facing cost API with allocation method and confidence score.
Common pitfalls recap
Don’t chase perfect attribution day one. Don’t let high-cardinality telemetry wreck your observability budget. And don’t ignore new cost centers — tokens, vector DB egress, and third-party API calls are the recurring surprises in 2026. Instrument them, show them to customers, and price accordingly.
FAQ
How accurate can per-tenant cost estimates be in 2026?
Good enough for operational decisions, billing guidance, and pricing changes — not an exact invoice unless every resource is taggable and dedicated. Direct-tagged costs match the bill exactly. Shared resources require allocation; choose metrics with strong correlation (CPU-seconds for compute, tokens for inference, bytes for egress) and publish a confidence score. Reconcile monthly against cloud CUR to tune allocations.
Should we use account-per-tenant for billing clarity?
Only for tenants that need strict isolation or regulatory separation. Account-per-tenant doesn’t scale well for hundreds or thousands of customers. Most teams in 2026 use centralized accounts with strong telemetry and allocation rules, reserving separate accounts for high-risk or very large tenants.
What’s the best way to handle runaway LLM inference costs?
Measure tokens at the request level, attribute inference hosting separately, and expose inference as a billable add-on or quota. Use batching, caching, and cheaper model fallbacks when possible. Implement soft alerts and rate limits before hard throttles, and offer customers tooling to preview cost before running large jobs.
How do we prevent observability costs from becoming another runaway bill?
Enforce per-tenant metric limits, tier metrics by value, apply adaptive and cost-aware sampling (especially for token-heavy traces), redact and avoid high-cardinality labels, and use the Collector to enforce caps. Store raw telemetry short-term and retain aggregated trends long-term.
What’s the first thing to check if attribution gaps appear?
Check ingress enforcement: missing tenant IDs at the edge cause the majority of gaps. If the edge is clean, audit async paths (message queues, cron jobs) and vector DB/model client calls — tenant_id often drops there. Add CI checks that fail the build if instrumentation isn’t present.
Final word: start with a reliable tenant identity, instrument the high-cost flows (inference, vector egress, storage), and be transparent with customers. When you can show a reproducible method and a confidence score, billing conversations switch from finger-pointing to solutions. That’s the difference between being reactive and running a product that can price with confidence in 2026.